A-level
Remainder and Factor Theorems
The Remainder Theorem allows you to find the remainder when dividing a polynomial. The Factor Theorem allows you to find the factors of a polynomial and it makes use of the Remainder Theorem to do this.


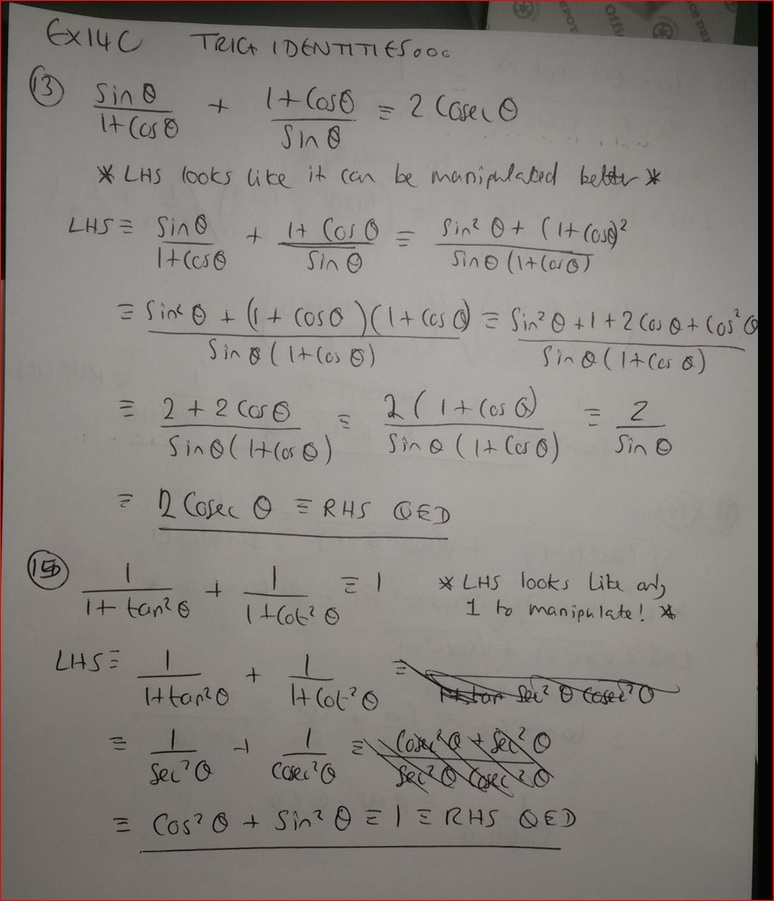
Trig Identities
tan = sin/cos
sin^2 + cos^2 = 1
1 + tan^2 = sec^2
1 + cot^2 = cosec^2


Newton's Laws of Motion


GCSE...
Shape transformations - rotations, reflections etc
Terminology to describe a transformation e.g. rotate anticlockwise 90 degrees about point (3,4)Translations : shape is not rotated or anything, just moved.
e.g. for triangle ABC moved 8 left and 6 up
The transformation from ABC to A'B'C' is a translation by the vector (-8 over 6) [-8 should be written above 6]
Rotations :
for a rotation you need to mention 3 things - angle, direction of turn and the point about which the rotation occurs.
e.g The transformation from ABC to A'B'C' is a rotation of 90
degrees anticlockwise about the origin (or
some other coordinate)
Reflections :
Here the transformed shape will be a mirror of the original. You need to find the straight line about which that describes that mirror line.
e.g. The transformation from shape A to shape B is a reflection in the line y = x
Also need to fill in Enlargements and Scale factors...
There are an infinite number of graphs, y = 3x, y = 4x + 1, y = 5(x-1) and so on, so the general way to say "the value of y is a calculation using the x value" is to say "y is a function of x" or : y = f(x).
Various transformations can be applied to a graph of y = f(x):
Stretches occur when you apply a multiplier to the function or to the x value:
Reflections :
Here the transformed shape will be a mirror of the original. You need to find the straight line about which that describes that mirror line.
e.g. The transformation from shape A to shape B is a reflection in the line y = x
Also need to fill in Enlargements and Scale factors...
Graph transformations
A graph is a set of points with x and y coordinates where the y coordinate depends on applying some calculation (a function) to the x value. Take "y = 2x". To calculate the y value of a point, we apply the calculation "times by 2" to the x value.There are an infinite number of graphs, y = 3x, y = 4x + 1, y = 5(x-1) and so on, so the general way to say "the value of y is a calculation using the x value" is to say "y is a function of x" or : y = f(x).
Various transformations can be applied to a graph of y = f(x):
Stretches occur when you apply a multiplier to the function or to the x value:
- the y-stretch : y = kf(x) : y value is the usual f(x) value multiplied by constant k. The effect on the graph is to make the y larger in magnitude where k > 1 (stretch) and smaller where k < 1 (scrunch) than in the original graph.
- the x-stretch : y = f(kx) : the x value is multiplied
by k before the calculation is applied to it. It will scrunch
the graph up when k > 1 and stretch it out when k < 1.
- the y-shift : y = f(x) + a : the whole graph looks identical to y = f(x) except it has shifted up or down the y-axis by the amount a. So if y = f(x) + 1 then the graph is the same as for y = f(x) but will have moved up 1.
- the x-shift : y = f(x-a) : the whole graph looks identical to y = f(x) but is shifted to the left or the right. It's a bit unintuitive so just learn what happens with an example:
- y = x i.e. f(x) = x : this graph is a simple diagonal straight line going through the origin (0,0).
- now we want to subtract 1 from x, i.e. y = f(x-1). In
this case the graph will be the same as y = x but will move
+1 along the x axis (left to right!)
- if instead we want to add 1 to x, i.e. y = f(x+1), the graph will instead move back, right to left by 1 along the x-axis
- negating x : y = f(-x). Your new graph will be an mirror image of the original about the x-axis.
- negating f(x) : y = -f(x). Your new graph will be a mirror of the original about the y-axis. (quite intuitive really, as your original y value = f(x) and your transformed y value = -f(x), so we're saying "transformed y = -old y".
Geometry
Congruence of triangles - If 2 triangles are
congruent it just means they are the same. They might be rotated
or reflected, but they still have all sides and angles the same.
How to tell if 2 triangles are congruent:(1) all the sides have
the same length
(2) 2 angles are the same and a corresponding side has the same
length
(3) 1 angle and the 2 sides around it are the same
(4) triangles are right-angled and the hypotenuses are equal and one other side is equal
(3) 1 angle and the 2 sides around it are the same
(4) triangles are right-angled and the hypotenuses are equal and one other side is equal
Cumulative Frequency and all that...
Averages and Spreads- Mean - the average (total / number of items)
- Median - the middle value (once items have been lined up in order of size)
- MOde - MOst common
- Range - difference between largest and smallest
- arrange data in ascending order first e.g. 2,4,7,9,11,15
- There are 3 quartiles - lower (bottom 25%), median (middle 50%) and upper (top 25%).
- The Interquartile range is the difference between the upper and lower quartiles.
- lower quartile number = (n+1)/4 (so in our example above it is 7/4 = 1.75)
- median quartile number = 2(n+1)/4 (in above example = 14/4 = 3.5)
- upper quartile number = 3(n+1)/4 (in above example = 21/4 = 5.25)
- interquartile range = 5.25 - 1.75 = 3.5
median
------------------
|------------------| | |------------------------------|
lowest ------------------ highest
value lower upper value
quartile quartile
If the box takes up a lot of the diagram, then the interquartile range is large, meaning that most numbers are in the middle, and there are relatively few at the low and high ends.
if say there's a long line from the lowest value to the start of the box and a short line from the end of the box to the highest value then most of the values are towards to bottom end, with relatively few in the mid and high ranges.
Cumulative frequency
- populate table
- draw graph
- get
median, lower and upper quartiles from it
A cumulative frequency graph will always put cumulative frequency on the y-axis. Note also that you always start y-axis at 0 and go to the maximum cumulative frequency value. What you're measuring (in this case height) on the x-axis. When you plot the graph you use the highest value in the range. For example
Height Ranges Freq Cum. Freq
140 < h <= 150 cm 4 4
150 < h <= 160 cm 9 13
160 < h <= 170 cm 7 20
Cum Freq goes on y-axis, 0 up to 20.
Height goes on x-axis, no need to start at 0, so just 140 -> 160
Using the max height in each range, points to plot are (140, 4), (150, 13), (160, 20).
HAVE I GOT THAT WRONG? USING MAX HT, SHOULD BE 150, 160, 170!!
Draw a curved line from ZERO to the end point.
What is the use of the cumulative frequency graph?
The final cumulative frequency (20) is the total number of boys, so the middle is 10. Draw a horizontal line at 10 on the graph, till you hit the curve and draw vertically down from there to get the median height.
A quarter of the way up is 5 and three quarters of the way up is 15. Draw similar lines for these to discover the lower and upper quartile heights.
And of course, with those numbers, you can calculate the interquartile range.
Histograms - show frequency density (FD = F / Class Width)
Use table to populate an FD graph (which is a histogram where FD always y axis, and what you're measuring is x-axis).
Recurring numbers
.
(1) Express 0.7 as a fraction.
let r = 0.7777...
so 10r = 7.7777...
so 9r = 7.7777... - 0.7777... = 7 (gets rid of the repeating part)
therefore r = 7/9
..
(2) Express 0.67 as a fraction.
let r = 0.676767....
so 10r = 6.76767....
we cannot get rid of the repeating part by doing 10r - r as numbers don't line up:
6.767676...
-0.676767...
----------
arrgh!
So rather than 10r, lets create 100r:
100r = 67.6767....
now 100r - r is 67.6767... - 0.6767.. = 67
so 99r = 67
r = 67/99
..
(3) Express 0.281 as a fraction
This is he worst you're likely to see, where the number is partly non-repeating and partly repeating. You do exactly the same things though...
let r = 0.2818181...
10r = 2.818181... (repeating parts dont match up so try 100r)
100r = 28.18181... (repeating parts dont match up so try 1000r)
1000r = 281.818181... (10r and 1000r repeating parts match, so subtract...)
1000r - 10r = 279
990r = 279
r = 279/990 (now simplify...)
r = 31/110
No comments:
Post a Comment